Here's a tip how to find out where the info message is thrown.
First, add a breakpoint in the Info class, method add:
After that, run the script that throws the error. As soon as the error message is thrown, the Axapta debugger will pop up:
 At the lower part of the screenshot, you can see the call stack (if not, go to menu "View" and activate menu item "Call stack").
In the call stack, you can double-click on any line and the debugger will go back to it. Let's say we clock on the third line of the screenshot above. The debugger will take us to the Class TaxCov, method TaxLedgerCov:
 You can see that the debugger put us exactly to the place where the error was thrown.
With the above method, it's pretty easy to find your way around the infos that Axapta gives you.
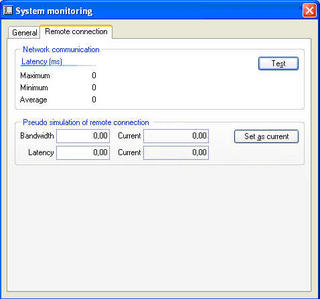 In the system monitoring window, also a Pseudo-simulation of a certain bandwidth and/or latency can be tested.

